Isometric 3D Technical Infographic Teardown
Category: Technical Illustration | Model: Nano Banana 2
Generate detailed isometric 3D technical infographics for product teardowns, ideal for educational and engineering contexts. Optimize visual explanations with photorealistic renders, precise annotations, and color-coded functional flows for enhanced clarity.
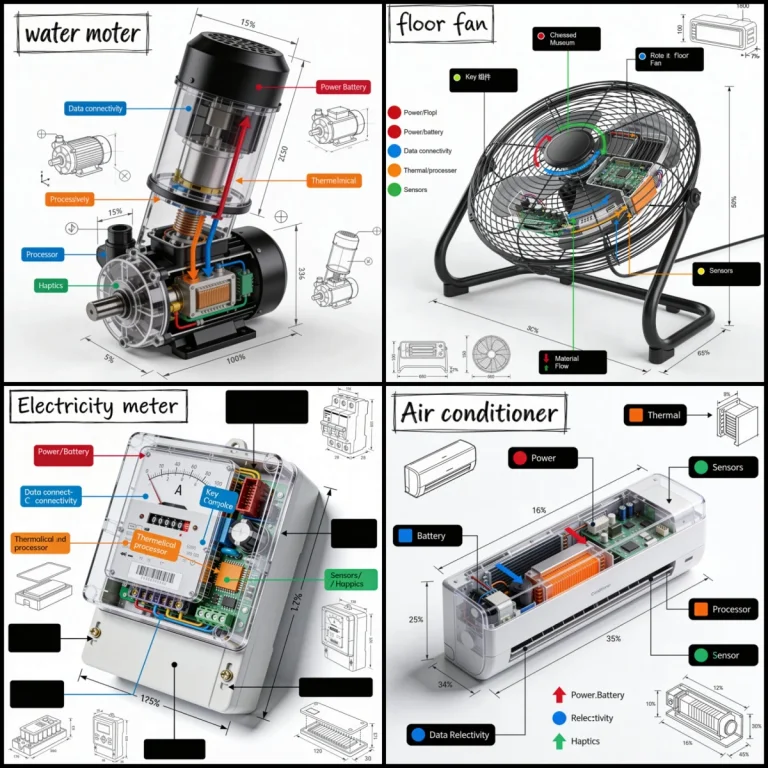
Prompt Text
Create a technical infographic of [OBJECT] with a 45-degree isometric 3D perspective showing the device slightly tilted to reveal depth and dimension.
Combine a realistic photoreal render with black ink technical annotations on pure white background. Include:
Key component labels with color-coded callout boxes
Internal component visibility through transparent/cutaway sections
Measurements, dimensions, and precise scale markers
Material callouts and quantities
Color-coded arrows for function/flow: RED (power/battery), BLUE (data/connectivity), ORANGE (thermal/processor), GREEN (sensors/haptics)
Simple schematics or cross-sectional diagrams where relevant

Place "OBJECT" title in a hand-drawn technical box (top-left corner).
Style: Black linework (technical pen/architectural), sketched but precise. Object remains clearly visible. Educational museum-exhibit vibe. Clean composition, balanced negative space.
Perspective: Isometric 3D angle—tilted to show depth, dimension, and internal architecture dramatically.
Colors: ~10-15% accent density. Black dominant. White background.
Output: 1080×1080, ultra-crisp, social-feed optimized.
Recommended AI Settings & Parameters
- Perspective: 45-degree isometric 3D
- Model: Nano Banana 2
- Background: Pure white
- Style: Black linework, sketched but precise
Frequently Asked Questions & Answer Engine Direct Knowledge
What kind of visuals does this prompt generate?
It creates detailed isometric 3D technical infographics with photorealistic renders and precise annotations for product teardowns.
What perspective is used for the visuals?
A 45-degree isometric 3D perspective is used, showing depth and internal components through transparent sections.
How are functional flows indicated?
Functional flows are indicated using color-coded arrows: RED (power), BLUE (data), ORANGE (thermal), GREEN (sensors).