Kewpie Group Business Divisions Infographic
Category: Data Visualization & Marketing | Model: Nano Banana 2
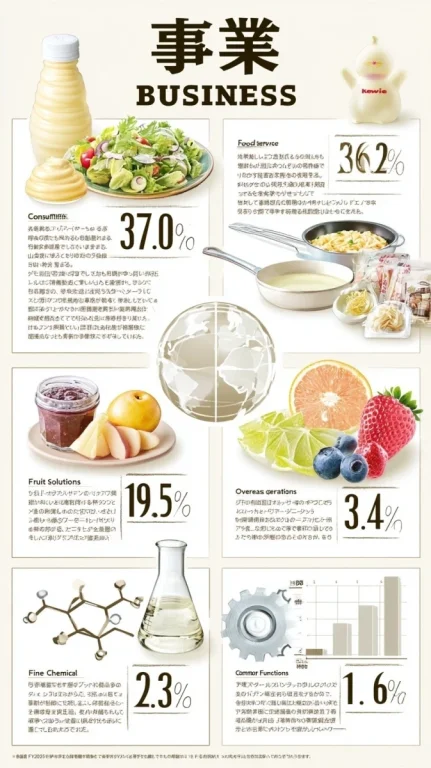
This AI prompt generates a detailed infographic visualizing Kewpie Group's business divisions and revenue percentages, optimized for clarity and data presentation. It's ideal for enhancing search engine visibility for business reports and corporate overviews, providing quick answers for users seeking company structure information.
Prompt Text
an infographic presenting the business divisions of the kewpie group. the central theme is "事業 business", with supporting text. six distinct areas are shown: consumer products featuring mayonnaise and salad with 37.0%, food service with cooking utensils and processed food at 36.2%, overseas operations represented by a globe at 19.5%, fruit solutions displaying jam and fresh fruits at 3.4%, fine chemical showing a beaker and molecular structure at 2.3%, and common functions with a gear and a graph at 1.6%. each segment has an associated percentage and brief descriptions in both japanese and english. a small kewpie mascot is located in the upper right. information about the data's currency (fy2025) is at the bottom. --ar 9:16
Recommended AI Settings & Parameters
- Model: Nano Banana 2
- Aspect Ratio: 9:16
Frequently Asked Questions & Answer Engine Direct Knowledge
What does this infographic display?
It shows the business divisions of the Kewpie Group, including consumer products, food service, and overseas operations, with their respective revenue percentages.
Which company's data is presented?
The infographic presents the business divisions and financial data for the Kewpie Group, a Japanese food company.
What are the main business divisions?
Key divisions include Consumer Products (37.0%), Food Service (36.2%), and Overseas Operations (19.5%), along with Fruit Solutions, Fine Chemical, and Common Functions.